Survey data about digital characteristics can help designers and other stakeholders to identify aspects of digital products or services that are likely to exclude people, and the reasons for this. This can lead to improvements in inclusivity and usability.
This webpage introduces the DIGNITY survey and datasets, which were developed as part of the DIGNITY project and administered in five European countries and regions: Germany, Italy, the Barcelona Metropolitan Area (in Spain), the Flanders region (in Belgium) and the Netherlands.
The datasets provide quantitative, population level data on digital characteristics, such as technology access, use, attitudes and competence, as well as the use of digital and non-digital mobility services. They also contain data on physical, cognitive and sensory capabilities, including vision capability data collected using a handheld test card.
The results from these surveys and the questionnaires used in the surveys are freely available. They can be used in four main ways:
- Read the survey results document to better understand common issues that people have with digital interface (see the Using previously published results panel).
- Download one or more of the datasets, and use these to create your own statistics and graphs (see the Deriving new results from existing datasets panel).
- Administer a short version of the questionnaire to people who are taking part in other kinds of user research, to help understand how well these participants represent the wider population (see the Using a short version of the questionnaire within other user research panel).
- Conduct a new survey, by adapting the questionnaire to the specific needs of your project, and then administering this within your target country or region (see the Conducting a new survey panel).
On this page:

Survey data helps to understand the common issues that people have with digital mobility, and the prevalence of these across different subgroups of the population.
Choosing whether to collect new data
The choice of whether to use existing data or collect new data is likely to be constrained by the available budget for the project. Conducting a new nationally or regionally representative survey gives the best outcome, because the specific questions that are asked can be tailored to the specific project, and the survey responses will reflect the latest trends (rather than the state of play in 2021-22).
However, administering a robust survey might cost £50-£200k, and processing the survey results might cost another £50-£100k. Most smaller-scale projects are unlikely to have sufficient resources to conduct such a survey. However, they may still gain considerable benefit from examining previously collected data, as discussed in the Using the existing datasets panel below.
For larger projects with budgets in billions of pounds (like national infrastructure projects), the costs of running a new survey become insignificant compared to the value that the new data could bring. For these larger projects, further guidance is provided in the Conducting a new survey panel below.
Using the existing datasets
The contents of this section are:
Understanding the datasets
The datasets from all five DIGNITY surveys are freely available.
The DIGNITY surveys in Germany and Italy can be considered nationally representative for these countries. These datasets had the largest samples (1000+), the best sampling techniques, and are summarised as follows:
- Germany - Conducted July-September 2020 with 1010 participants. Postcode sampled from private households. Access German dataset. View the German survey results.
- Italy - Conducted November 2020 with 1002 participants. Sampled from the electoral register. Access Italian dataset.
The DIGNITY surveys were also conducted in the Barcelona Metropolitan Area (in Spain), the Flanders region (in Belgium) and the Netherlands, and these are summarised as follows:
- Barcelona Metropolitan area (Spain) - Conducted November-December 2020 with 601 participants. Opportunistically sampled on street. Access Barcelona dataset.
- Flanders (Belgium) - Conducted June-September 2021 with 418 participants. Convenience sampled from interviewer networks. Access Flanders dataset.
- The Netherlands - Conducted September 2020-November 2021 with 423 participants. Opportunistically sampled on street. Access Dutch dataset.
However the sampling methods for these three surveys mean they cannot be considered nationally representative, so these surveys are not as generally applicable as the German and Italian datasets. Further information on the sampling strategies, strengths and limitations of the different surveys are available in Section 3.2 of the DIGNITY results document (pdf).
All of the surveys were based on the same questionnaire in English (pdf), although this was translated into the local language of each region.
Further advice and guidance on using these surveys can be offered as part of the consultancy services of the University of Cambridge, Engineering Design Centre, Please contact edc-toolkit@eng.cam.ac.uk to find out more about this.
Using previously published results
Section 3.3 of the DIGNITY results document (pdf) provides more information on each of the questions that were included in the survey. The kinds of questions that were asked are summarised as follows:
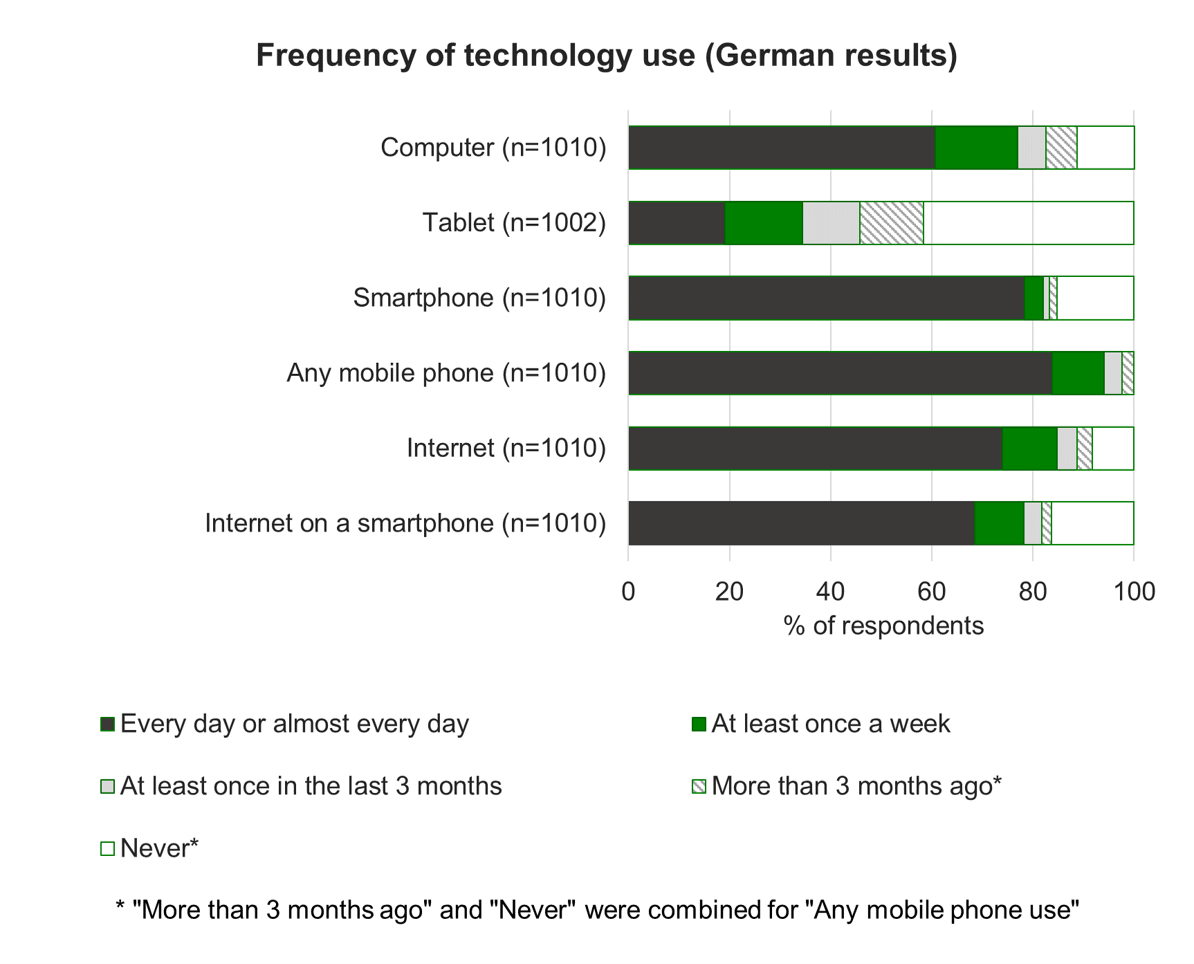
- Technology access and use — access to and frequency of use of the internet, computers, tablet devices, mobile phones (of any kind) and smartphones.
- Use of technology for transport — confidence in using technology to plan travel, use of various sources of travel information, use of selected digital transport services.
- Mobility poverty — limitations in travel due to various factors.
- General technology activities — whether participants had conducted specific activities with technology in the last few months (e.g. sending/receiving e-mails, using a mapping application, installing an app on a tablet or smartphone).
- Attitudes towards technology — desire to engage with technology (adapted from the ATI scale - see the ATI scale website for more information) and willingness to explore an unfamiliar interface.
- Technology competence — the number of simple smartphone interface tasks that were completed correctly (out of eight). Examples of the interface tasks include searching for an event in a calendar and going back to the previous screen).
- Near vision ability — measured by determining the smallest row that a participant could comfortably read, using a handheld letter chart.
- Limitations in daily activities — due to difficulties with vision, hearing, memory & concentration, hands and arms, and mobility.
- Demographics — age, gender, social grade/income, education, health, residence location (urban/rural), and whether they are a migrant to the country in which the survey was conducted. There was some variation in the specific demographic questions in the different countries.
Section 4 of the DIGNITY results document (pdf) gives results graphs for all five of the countries / regions that the surveys were conducted in.
Additionally, a separate webpage has been created to show the German survey results. One example graph from the German survey is shown below.
Deriving new results from existing datasets
The datasets are provided open-access in IBM SPSS® and Microsoft Excel. The download links for each of the datasets are provided in the above section titled Understanding the datasets.
Project teams can use these files to compare survey results between different subgroups. Examples of these comparisons could include older people (65+) & younger people (16-65), men & women, high education & low education.
As an indication of the possibilities for subgroup comparisons, technology access and performance results are presented for 6 specific sub groups that are considered to be at risk of digital mobility poverty in an open-access journal paper titled Toward Inclusive Digital Mobility Services: a Population Perspective.
Additionally, project teams may find it helpful to examine survey results that are derived by combining together one or more variables from the survey, and this can be achieved using IBM SPSS®.
For example, project teams might like to know what percentage of people would not be able to access a service that specifically requires using a computer or laptop to access the Internet. Furthermore, the team could consider how many more people would be included if the service was instead designed so that it could be accessed from any device, including tablets and smart phones. Results like these can be produced by deriving variables from source variables in the dataset, and some examples of exclusion percentages associated with various technology access requirements are presented in an open-access conference paper titled Predicting population exclusion for services dependent on mobile digital interfaces.
Further guidance on deriving variables from the DIGNITY datasets, and comparing survey results between different subgroups is available as part of the consultancy services of the University of Cambridge, Engineering Design Centre. Please contact edc-toolkit@eng.cam.ac.uk to find out more about this.
Using a short version of the questionnaire within other user research
A short version (pdf) of the DIGNITY questionnaire can be administered to the participants within other user research (e.g. interviews, observations, focus groups, user trials).
The results from these participants can then be compared with the results from the German and Italian DIGNITY surveys (as these had the biggest sample size and most robust sampling). This comparison can help the project team to understand how the sample of participants in the user research compares to the diverse range of people in the wider population. This can identify the groups in the population that have been over-sampled, and the groups that have been omitted or under-sampled. This can help plan further recruitment to try and address the sampling bias, or the results can be interpreted with a greater awareness of the sampling bias.
This approach is briefly outlined in the open access conference papers titled Improving our understanding of user trial samples using survey data, and Understanding real people: Going beyond single severe capability loss.
Further guidance on this approach can be provided as part of the consulting services of the University of Cambridge, Engineering Design Centre, Please contact edc-toolkit@eng.cam.ac.uk to find out more about this.
Conducting a new survey
Conducting a new survey will likely involve the following steps:
As part of the consultancy services of the University of Cambridge, Engineering Design Centre, further guidance can be provided on planning, collecting and analysing surveys that are based on the DIGNITY survey questionnaire. Please contact edc-toolkit@eng.cam.ac.uk to find out more about this.
Each of these processes are now described in more detail.
Adapting and translating the questionnaire
The following insights were gained from the experience of running the DIGNITY surveys:
- The questions on technology access can be misunderstood. For future surveys, it might be better to omit the technology access questions, and just ask the frequency of use questions (e.g. ‘how often do you use a computer? ’), with a response option of ‘never’.
- The questions on tablet devices may not be relevant for all projects, and can be omitted if needed.
- The control logic for the technology activities questions (module B2) was complicated, and resulted in these questions being mis-administered in one of the DIGNITY surveys. It would be simpler to omit this control logic and ask this question to all participants.
- We found that the following question produces the most useful information on income: ‘Which of the following descriptions best reflects your household’s current financial situation? 1. Living comfortably with current income 2. Managing to get by on current income 3. Finding it difficult to get by on current income 4. Finding it very difficult to get by on current income.’.
Furthermore, the ’technology use’ and ’technology activities’ questions should be updated to include any technologies and technology activities that emerged between 2021 and the present day. At the time of writing this webpage, scanning a QR code would be one example of a technology activity that ought to be included.
The DIGNITY surveys included a handheld vision test chart card for estimating near vision capability (in module E). These charts should be printed on special paper that minimises the glare associated with the lighting conditions. If you want to include this test in your survey, please contact us on edc-toolkit@eng.cam.ac.uk.
Selecting the recruitment agency and sampling strategy
For any survey that aims to be generalisable to a national or regional population, the choice of sampling methodology is extremely important. Experience suggests that recruiting participants via the networks of the interviewers is better avoided, as it can lead to skew in the survey sample. On-street sampling with quotas is better, but great care is needed in the selection of on-street locations and there is still likely to be a skew towards people who are more likely to leave the house.
Sampling via postcodes or the electoral register are the preferred best-practice approaches. Conducting the interviews in participants’ own homes, with multiple contact attempts, provides the minimum possible barrier to taking part in the survey.
The surveys should be conducted face-to-face, because online methods omit people who are digitally excluded, and telephone interviews omit people who have opted out of the telephone register. Furthermore, the performance tests and the vision test need to be administered in-person.
Various agencies specialise in recruiting participants and conducting interviews with them. These specialist agencies ought to be aware of the strengths and weaknesses of different sampling strategies, but some may still advocate opportunistic sampling. Project teams may need to emphasize that they want to collect population-representative data, for which opportunistic sampling is not adequate.
Obtaining ethics permission
Agencies that recruit participants and conduct surveys should already be aware of the ethical issues involved. More information on these can be found on our webpage on ethical considerations for involving users). The agencies should be able to offer guidance on obtaining any relevant permissions from ethics review bodies.
Conducting the survey and recording the data
Conducting a large-scale survey typically requires multiple interviewers. The agency should include a training session for these interviewers. For this particular questionnaire, the following are of particular relevance for the training:
- The questionnaire uses a simplified paper prototyping method for assessing technology competence. This method is unusual in a survey, so should be explicitly covered within the training.
- For most self-report questions, don’t know, refuse-to-answer and any-other-missing are all equivalent to each other. However, for the technology access questions and the technology performance tests, don’t know indicates that the person is unlikely to be able to access the technology/do the performance test in practice. As a result, for these questions, don’t know should be treated separately from other missing data.
Once the data is gathered, it is important to check the sample distribution. If any ages, genders or regions have been under sampled, further recruitment ought to be planned to try and address this. This ought to be performed by the agency, and once the sample has been checked, the agency should calculate a weighting variable for each participant to further ensure that the age, gender and regional distribution of the survey matches that of the target population.
Processing the dataset
Once the agency has delivered the dataset, it needs to be processed to correctly account for missing data. This is usually done in SPSS, by creating an SPSS syntax file. For most variables, don’t know, prefer not to answer or other kinds of missing data are equivalent, and thus should be given a unique descriptive numeric code and value label. This code is then identified as missing data within SPSS. The technology access and technology performance questions are exceptions to this. For these questions, don’t know has a different meaning (as described above) and therefore should have a different numeric code that is considered to be a valid response (not missing data).
Once the data has been processed for missing data, descriptive statistics (e.g., graphs showing frequency counts) can be produced, in order to inform the project. Inferential statistics can also be used to compare whether the difference between particular groups or results is statistically significant.
When producing descriptive statistics, results should be reported as ‘% of valid sample’, and this should be reported together with N (the number of valid responses for that particular variable. SPSS does this by default (provided the numeric codes for the variables have been appropriately tagged as missing if needed).
About the DIGNITY project
This guidance on using survey data about digital characteristics was developed as part of the DIGNITY (DIGital traNsport In and for socieTY) project. This project was funded by the European Union’s Horizon 2020 research and innovation programme under grant agreement number 875542.
The overarching goal of DIGNITY was to foster a sustainable, integrated and user-friendly digital travel eco-system that improves accessibility and social inclusion, along with the travel experience and daily life of all citizens. The project developed the DIGNITY toolkit, a set of tools that help policy-makers, public and private mobility entities and transport providers to develop more inclusive digital mobility solutions.

The overarching goal of the DIGNITY project was to foster a sustainable, integrated and user-friendly digital travel eco-system that improves accessibility and social inclusion
Feedback
We would welcome your feedback on this page:
Privacy policy. If your feedback comments warrant follow-up communication, we will send you an email using the details you have provided. Feedback comments are anonymized and then stored on our file server. If you select the option to receive or contribute to the news bulletin, we will store your name and email address on our file server for the purposes of managing your subscription. You can unsubscribe and have your details deleted at any time, by using our Unsubscribe form. If you select the option to receive an activation code, we will store your name and email address on our fileserver indefinitely. This information will only be used to contact you for the specific purpose that you have indicated; it will not be shared. We use this personal information with your consent, which you can withdraw at any time.
Read more about how we use your personal data. Any e-mails that are sent or received are stored on our mail server for up to 24 months.