This page presents some of the headline results from the German DIGNITY survey. Detailed results from this survey are available in a DIGNITY project deliverable (pdf).
More information on the DIGNITY surveys can be found in the Survey data about digital characteristics page.
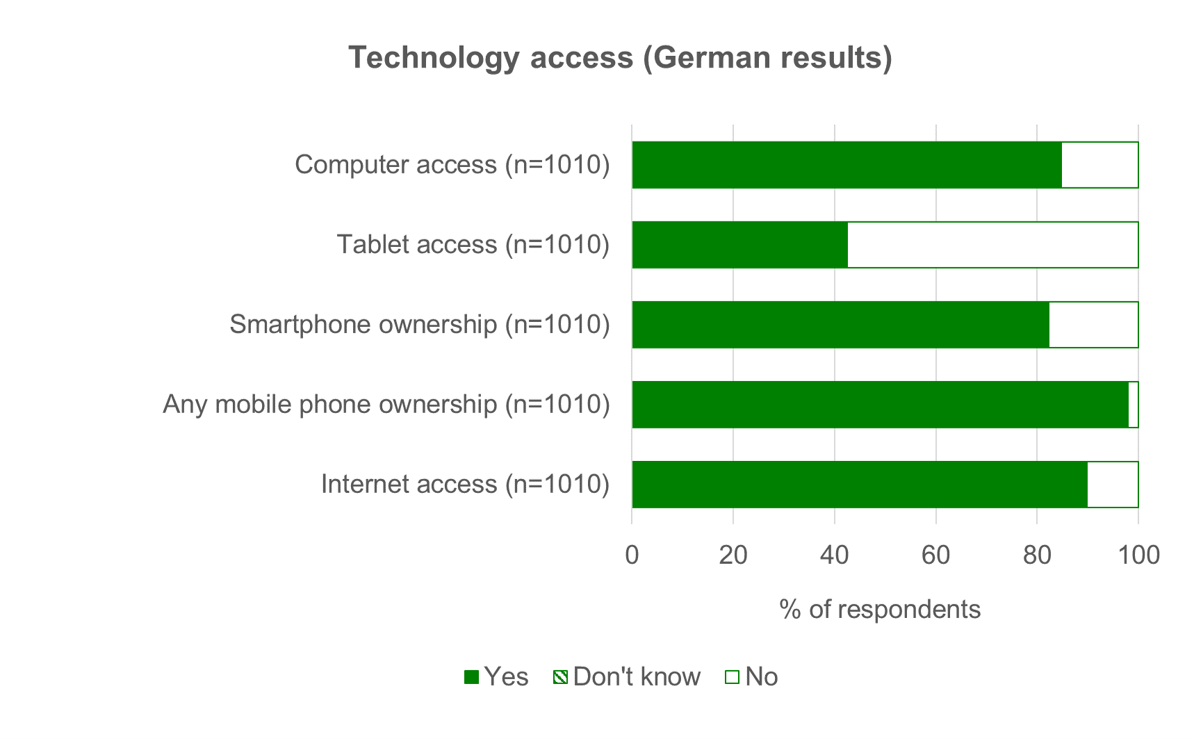
Module A: Technology access and use
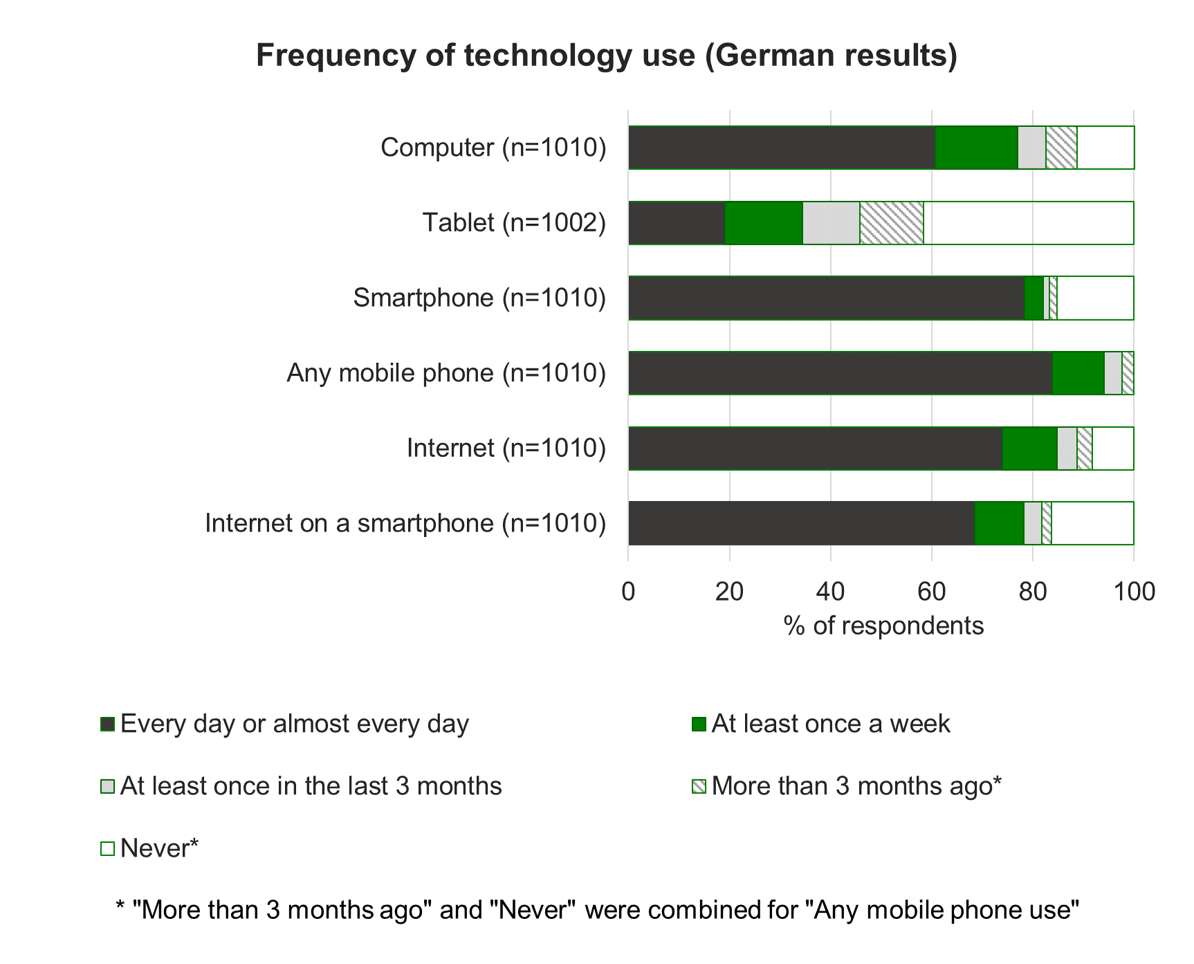
Module A of the questionnaire examined technology access and use. The first graph below shows the percentage of German respondents with access to different kinds of digital technologies, while the second gives a breakdown of the frequency of use of different digital technologies.
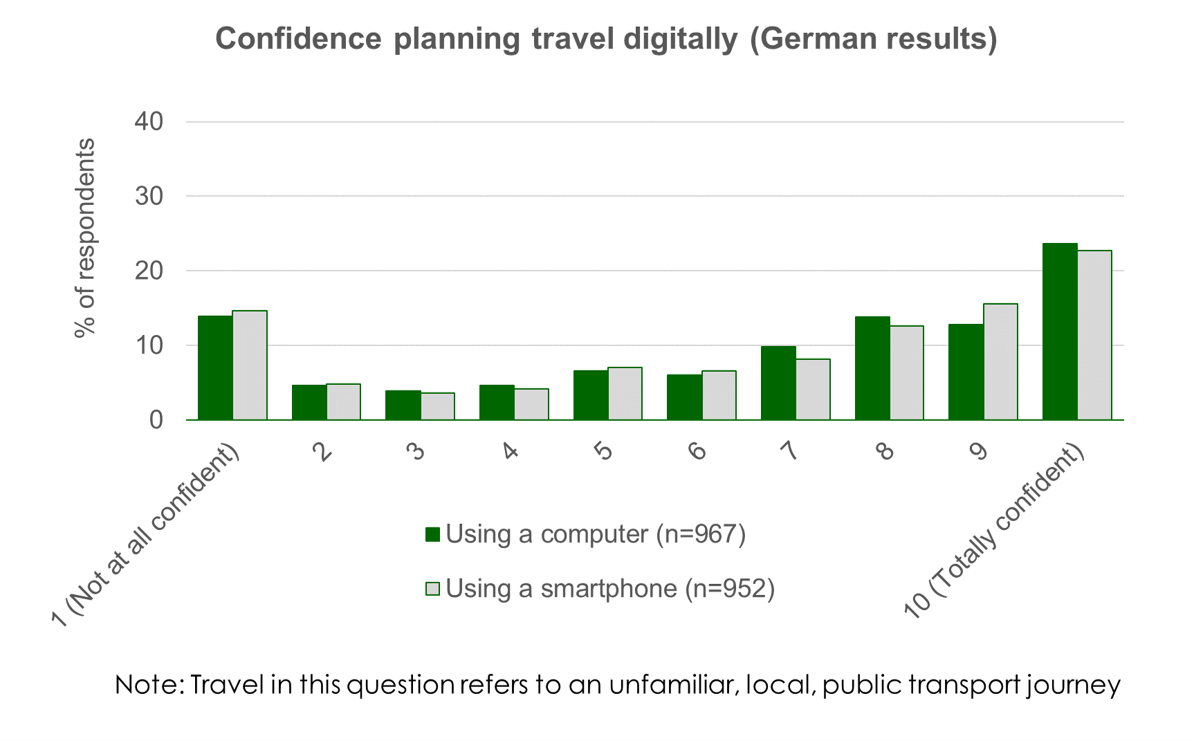
Module B1: Technology for transport
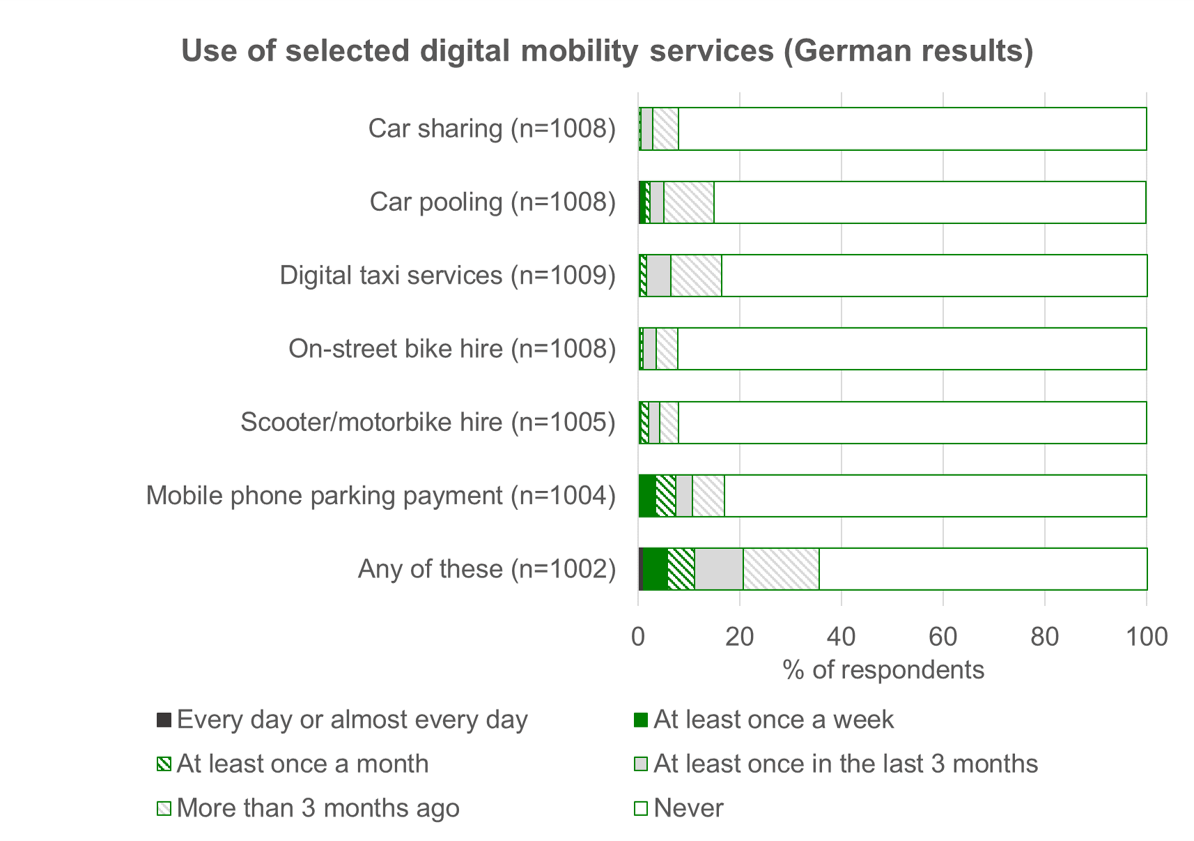
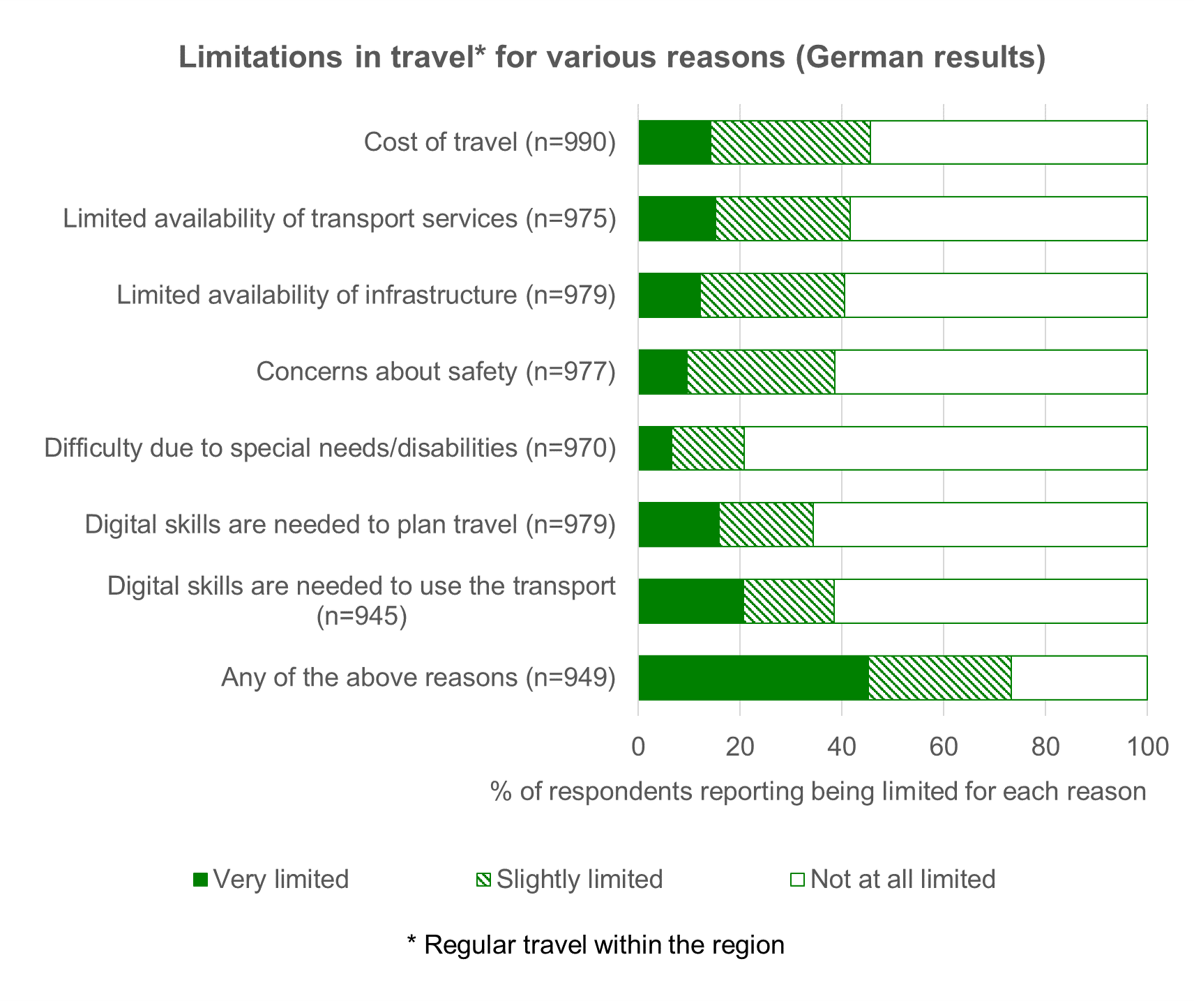
Module B1 examined various aspects of the use of technology for transport. The first figure below shows the distribution of respondents' ratings of their confidence in planning an unfamiliar, local, public transport journey using a computer and using a smartphone. The second figure describes the frequency of use of a selection of digital mobility services, while the third figure presents results on the proportions of respondents reporting feeling ‘very limited’ or ‘slightly limited’ in their regular travel within the region, for a variety of reasons.
Participants were also asked how they find out information about their travel. In the German survey, this question focused on travel by public transport only. Participants could select up to three responses. 52.6% of respondents included a digital information source in their selection (not counting responses of ‘Other’, while 26.7% listed non-digital sources only, and 20.7% said that they do not use public transport (n=1010).
Module B2: General computer and mobile device activities
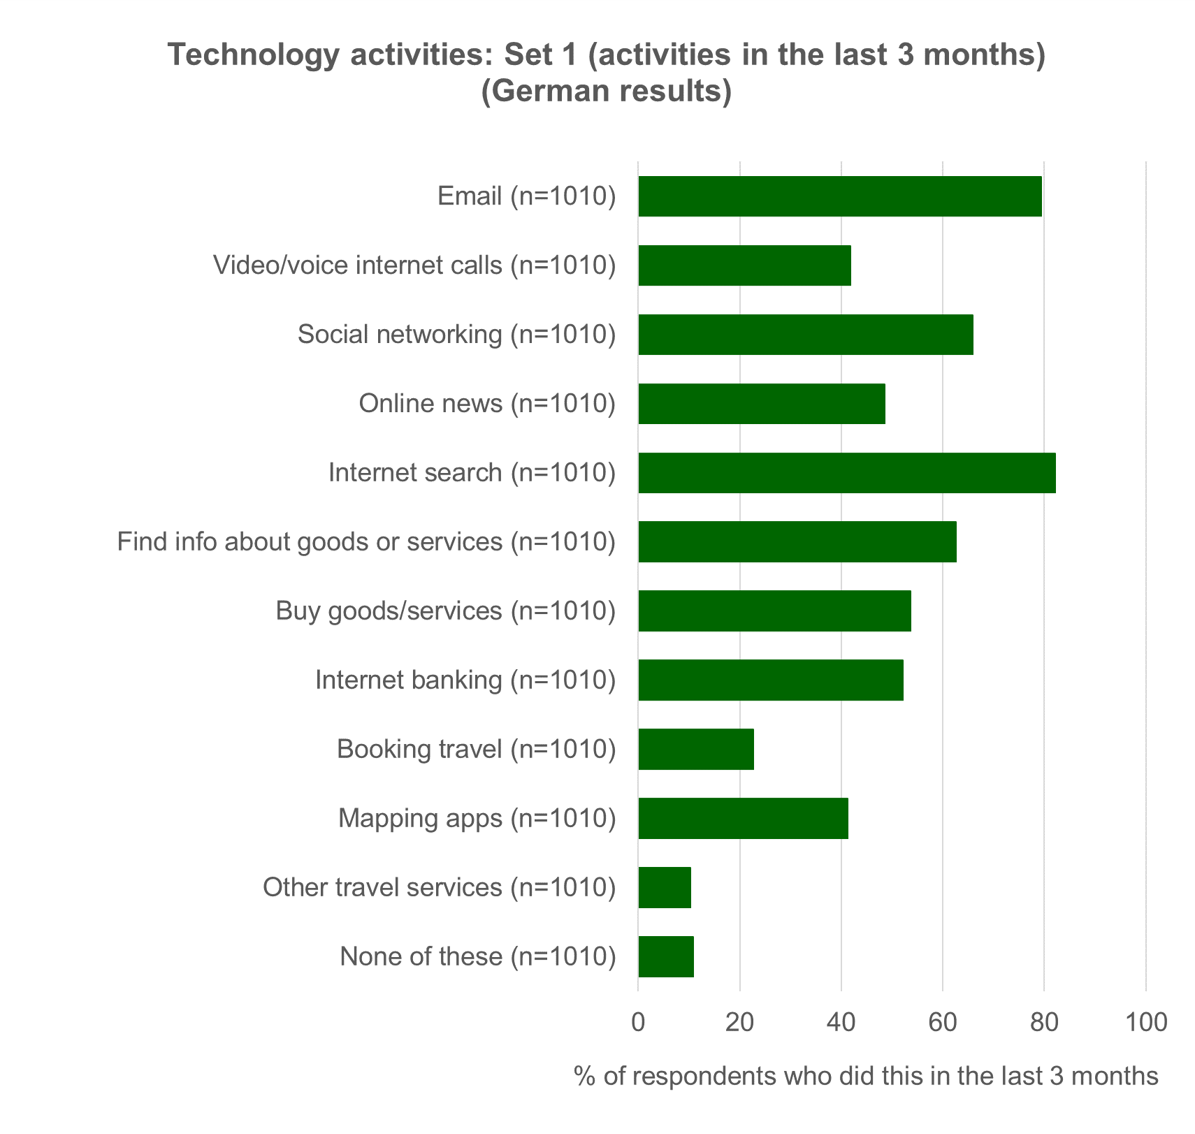
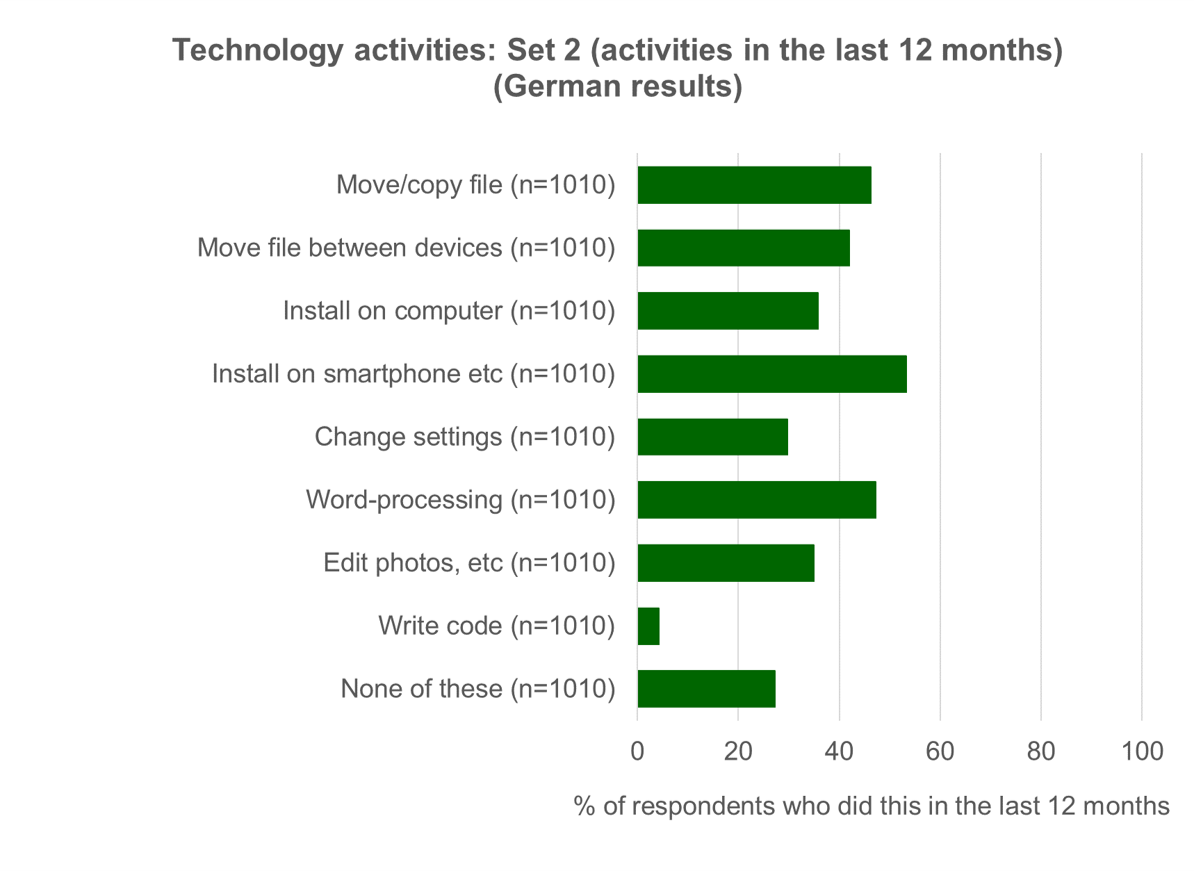
Module B2 examined general computer and mobile device activities. The first figure below reports on whether respondents had conducted an initial set of technology activities in the previous 3 months. The second figure examines a second set of activities that are commonly performed less frequently or relate to a deeper knowledge of technology devices. It reports on whether respondents had conducted these over the longer period of the previous 12 months.
Module C: Attitudes towards technology
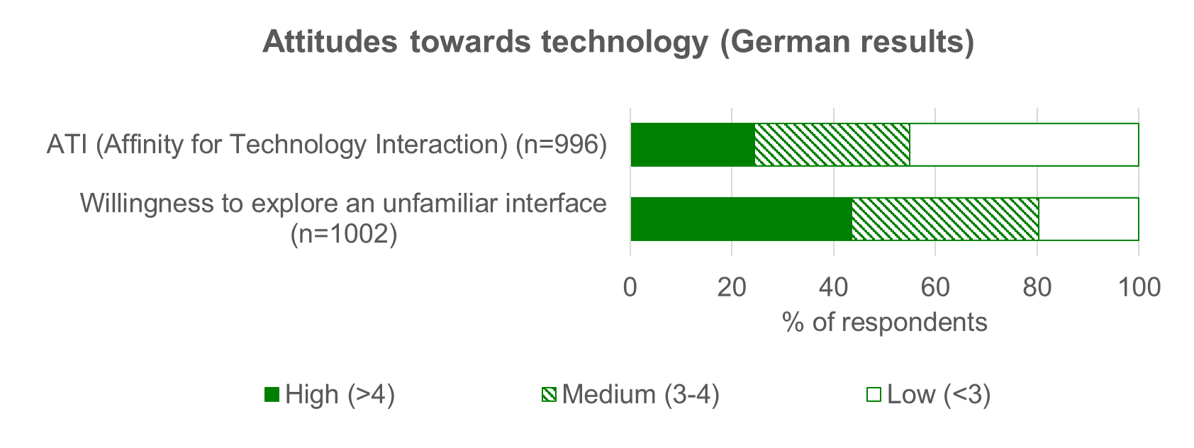
Module C examined attitudes towards technology. ATI (Affinity for Technology Interaction) and Willingness to Explore scores were calculated from the respondents' answers and were then categorised into Low, Medium and High. More information on how this was done can be found in Section 4.1 in the DIGNITY project deliverable (pdf).
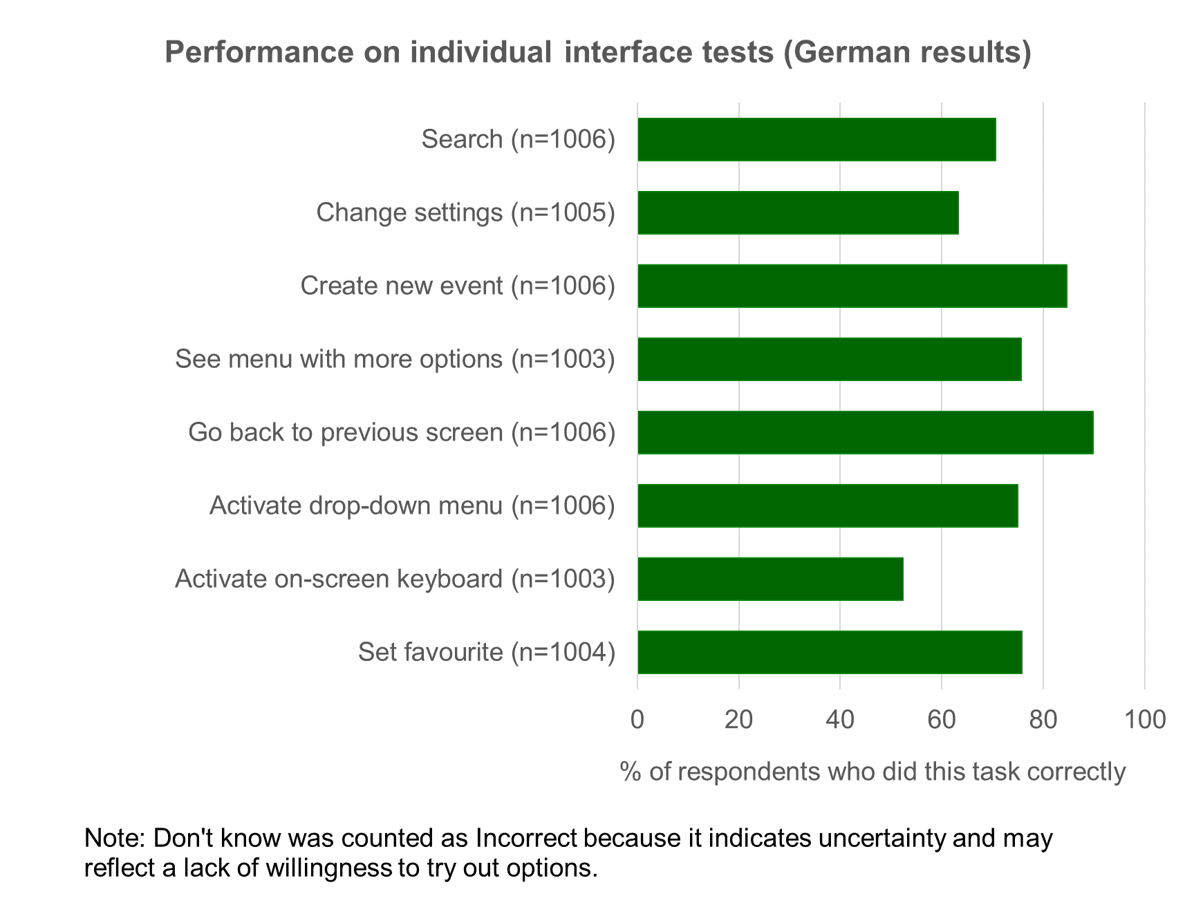
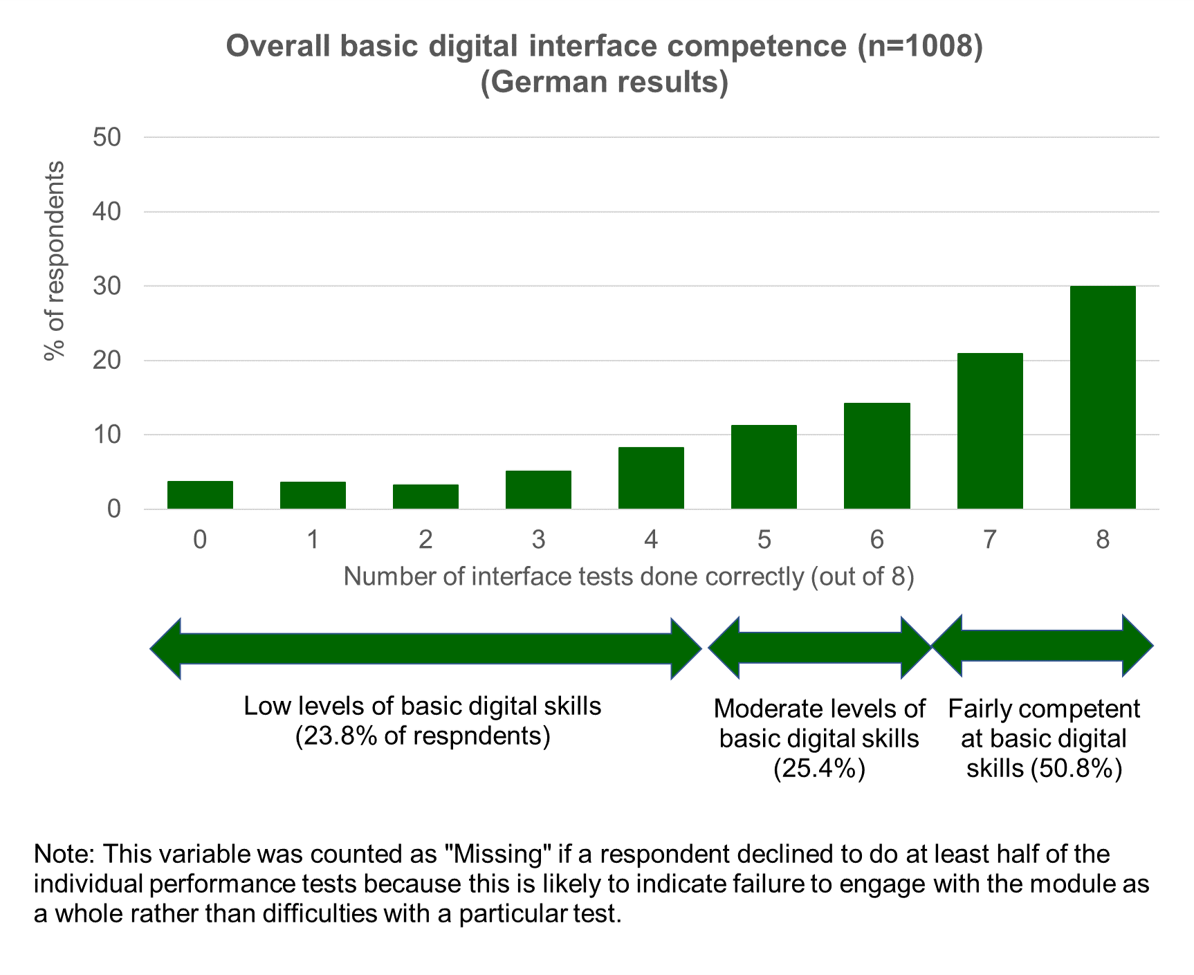
Module D: Digital interface competence
Module D examined digital interface competence using a set of 8 simplified paper prototype tests. The tests are described in full in Section 3.3.5 of the DIGNITY project deliverable (pdf). The first figure below describes the proportion of respondents who did each individual interface test correctly. The total number of tests done correctly was then used to give an estimate of the respondents' overall basic digital interface competence, shown in the second figure. The banding of results into Low, Medium and High competence is explained in Table 9 in Section 4.1 in the DIGNITY project deliverable (pdf).
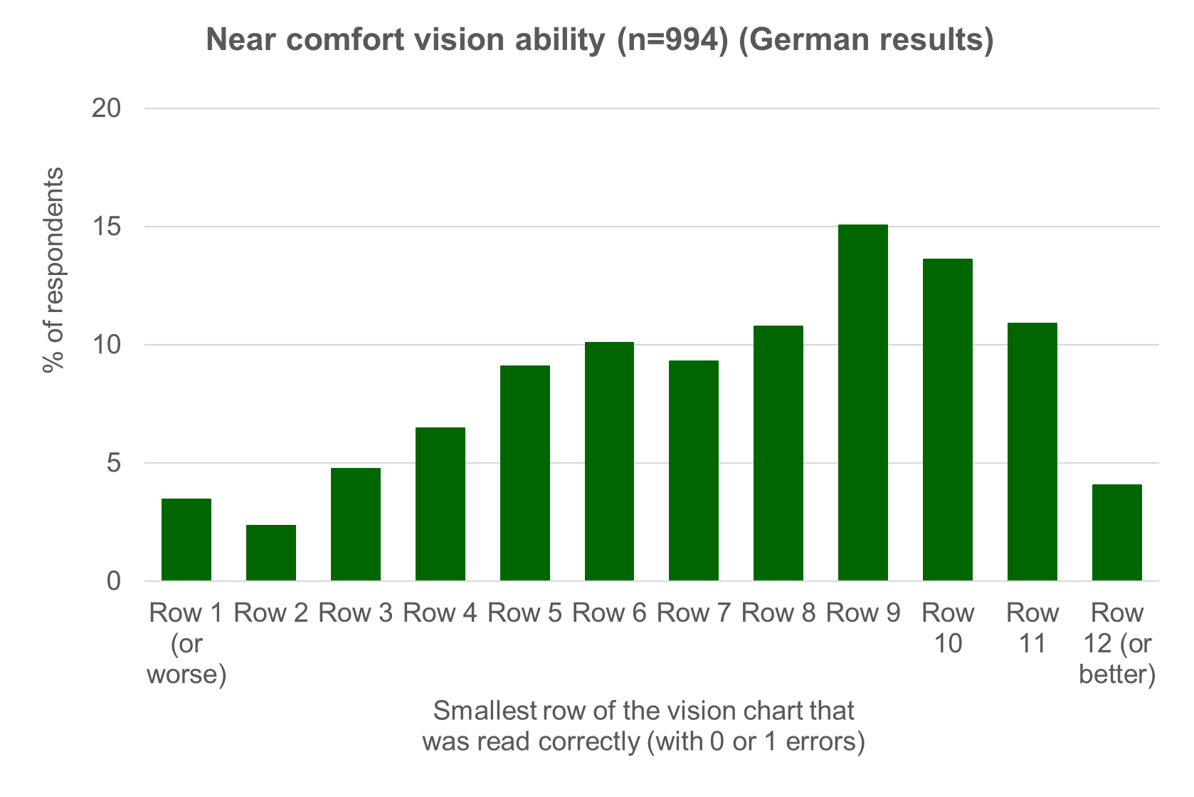
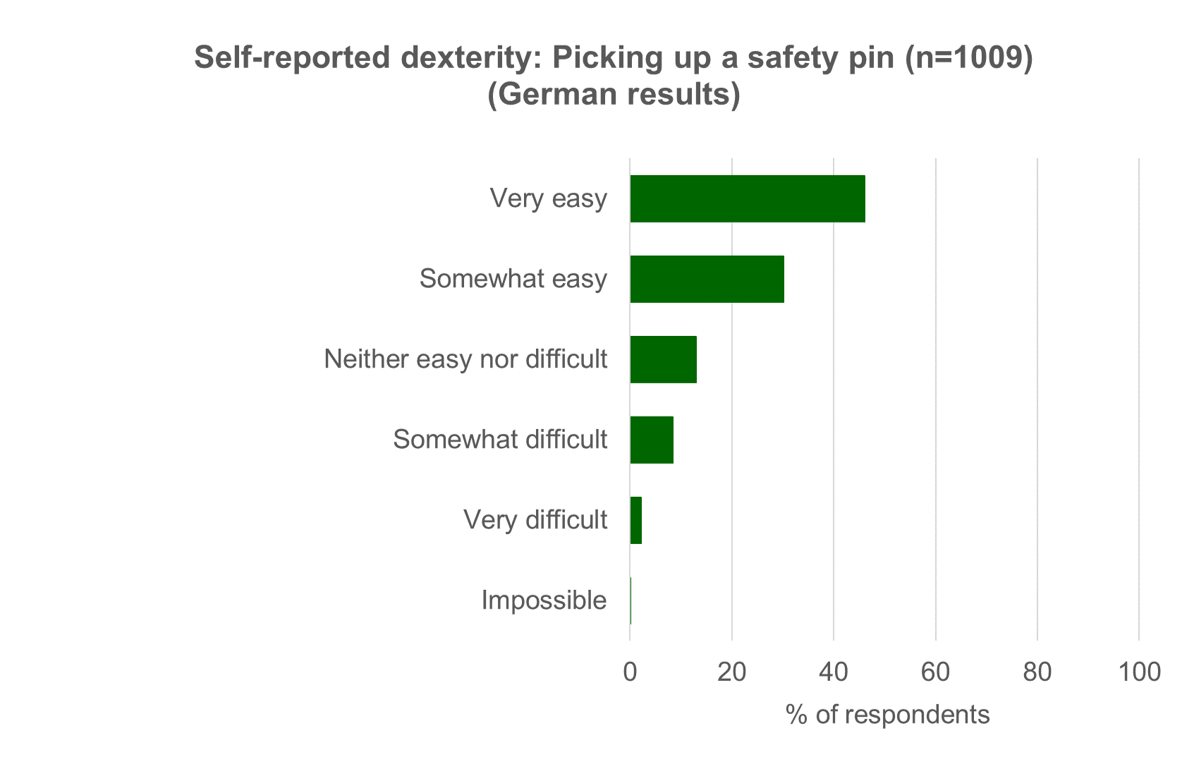
Module E: Capabilities
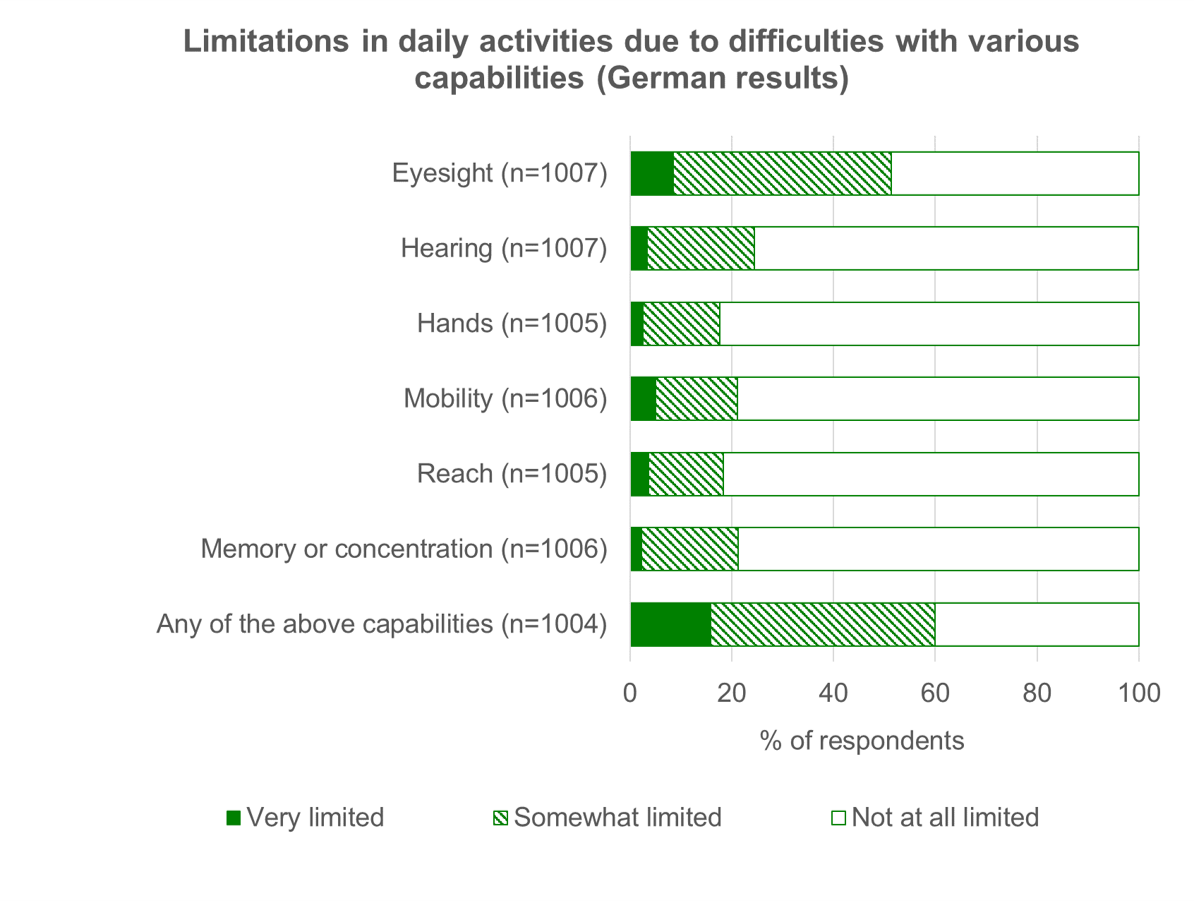
Module E examined physical, sensory and cognitive capabilities. The first figure below gives the results from the near comfort vision test, which was performed using a handheld vision test chart . Dexterity was then assessed by asking respondents how difficult they would find it to pick up a small object such as a safety pin. The results are shown in the second figure below. The third figure shows the proportions of respondents reporting being ‘somewhat limited’ or ‘very limited’ due to difficulties with various capabilities.
Feedback
We would welcome your feedback on this page:
Privacy policy. If your feedback comments warrant follow-up communication, we will send you an email using the details you have provided. Feedback comments are anonymized and then stored on our file server. If you select the option to receive or contribute to the news bulletin, we will store your name and email address on our file server for the purposes of managing your subscription. You can unsubscribe and have your details deleted at any time, by using our Unsubscribe form. If you select the option to receive an activation code, we will store your name and email address on our fileserver indefinitely. This information will only be used to contact you for the specific purpose that you have indicated; it will not be shared. We use this personal information with your consent, which you can withdraw at any time.
Read more about how we use your personal data. Any e-mails that are sent or received are stored on our mail server for up to 24 months.